
You’ve pulled campaign numbers, opened a spreadsheet, and hit a common wall. Likes look fine. Comments look decent. Reach is all over the place. Someone asks whether the campaign worked, and “engagement was strong” suddenly sounds flimsy.
That’s the main problem with most advice on how to calculate engagement rate. The maths is easy. The hard part is choosing the right formula for the decision you’re trying to make, then tying that number back to sales, bookings, reviews, or customer acquisition.
If you run influencer campaigns for a DTC brand, restaurant group, agency, or multi-location business, engagement rate only matters when it helps you answer a business question. Which creator should stay on the roster? Which post format is pulling real intent, not cheap reactions? Which local campaign deserves more budget? Those are the questions worth measuring for.
The Core Engagement Rate Formulas You Must Know
Good reporting starts with a simple choice. Pick the denominator that matches the decision you need to make.
A team reviewing creator content for quality should not use the same formula as a team checking paid amplification efficiency. Once those get mixed together, engagement rate stops being a decision tool and turns into a vanity metric with cleaner formatting.
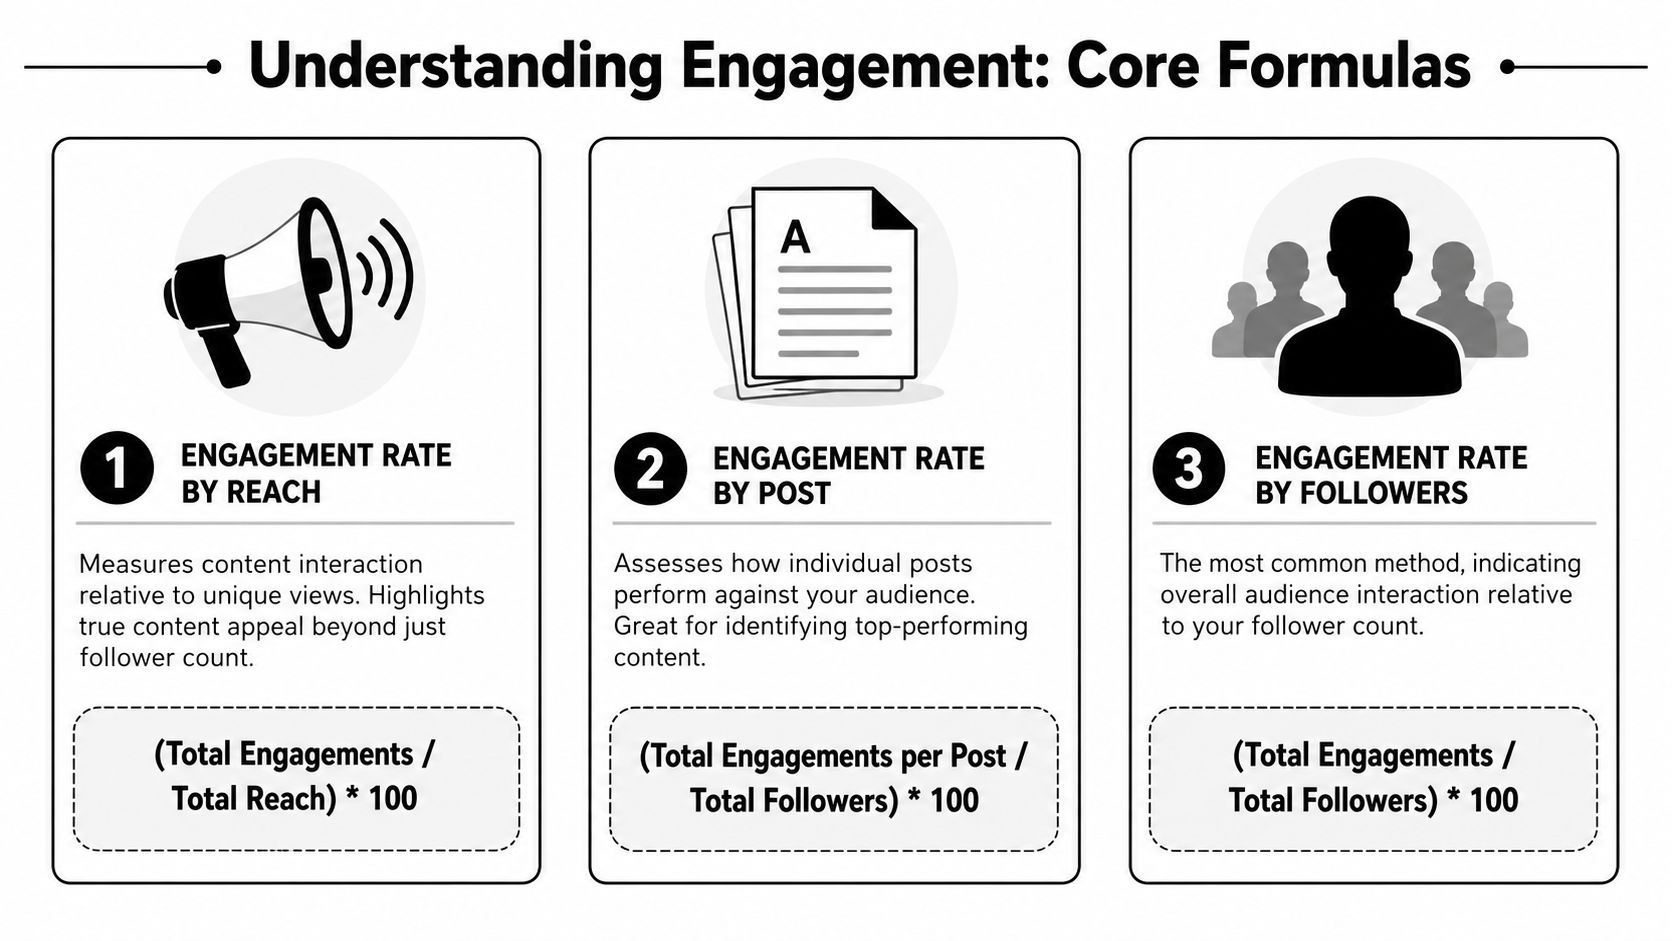
Engagement rate by reach
This is the first formula I use for post-level creative analysis because it measures response against actual exposure, not audience size on paper. Hootsuite’s engagement rate benchmarks update also points to ERR as a widely used method for practical reporting.
ERR = (total engagements on a post / reach of that post) × 100
If a post gets 250 engagements and reaches 7,353 people, the ERR is 3.4%. If another gets 300 engagements and reaches 8,571 people, the ERR is 3.5%. Across those two posts, the average campaign ERR is 3.45%.
That framing matters because reach shifts constantly. Format, posting time, paid support, creator distribution, and platform delivery all affect who sees the content. ERR controls for that better than follower-based formulas.
Use ERR when the question is, “Did this content persuade the people who saw it to do something?” For influencer teams trying to improve briefs, hooks, offers, or creative angles, that is often the right question.
Engagement rate by post
ER post is cleaner for creator comparisons because the denominator stays fixed.
ER post = (total engagements on a post / total followers) × 100
A restaurant chain with 5,000 followers gets 105 likes and 20 comments. That is 125 total engagements, which gives the post an ER post of 2.5%.
This formula is useful for shortlist reviews, monthly creator scorecards, and side-by-side comparisons where follower count still matters. It is less useful for judging true content strength, because followers do not equal viewers. On many accounts, a meaningful share of followers will never see the post at all.
That trade-off is why I treat ER post as a comparison metric, not a performance verdict. It helps you rank creators. It does not prove business impact.
Engagement rate by impressions
Impression-based engagement rate is the stricter option.
ER impressions = (total engagements on a post / total impressions) × 100
Impressions include repeat views. Reach does not. If one person sees a post three times, impressions go up three times while reach only counts that person once.
That makes this formula useful for paid creator content, whitelisted ads, boosted posts, and any campaign where repeated exposure is part of the plan. For pure organic reporting, it can understate performance because frequency drags the rate down even when the content is doing its job.
I use this one when media spend is involved and the primary question is efficiency, not just resonance.
Which formula to use when
A practical rule set keeps reporting cleaner:
Use ERR for creative quality and content resonance
Use ER post for creator-to-creator or account-to-account comparisons
Use ER impressions for paid distribution and frequency-heavy campaigns
Here is the trade-off in plain English:
Formula | Best use | Main strength | Main weakness |
|---|---|---|---|
ERR | Creative evaluation | Tied to actual exposure | Reach data can vary by platform |
ER post | Comparing posts or creators | Stable denominator | Ignores whether followers actually saw it |
ER impressions | Paid distribution analysis | Reflects repeated exposure | Can make high-frequency delivery look weaker than it should |
One more point matters if you care about ROI, not just tidy reporting. Engagement rate tells you how people reacted inside the platform. It does not tell you what happened after the click, visit, or code redemption. That is why I pair these formulas with UTMs, promo codes, and store-level tracking in reporting stacks that connect social activity to analytics platforms such as Google analytics mcp.
If you want a fast post-level sense check before building your own reporting sheet, an Instagram engagement calculator can speed up the maths. Use it to verify the rate. Use attribution to decide whether the campaign generated money.
Adapting Your Calculations for Different Platforms
A creator sends over a campaign report that looks strong on the surface. High views, plenty of likes, a few comments. Then you check site traffic, code uses, and assisted conversions, and the story changes. The post that looked average in-platform drove the revenue. The one with the flashy engagement count did very little.
That gap is why platform-specific calculation matters. “Engagement” is not a universal action. A save on Instagram suggests something different from a TikTok share, and neither behaves like a Story reply or sticker tap. If you force all of those into one generic numerator, the rate stays tidy while the insight gets worse.
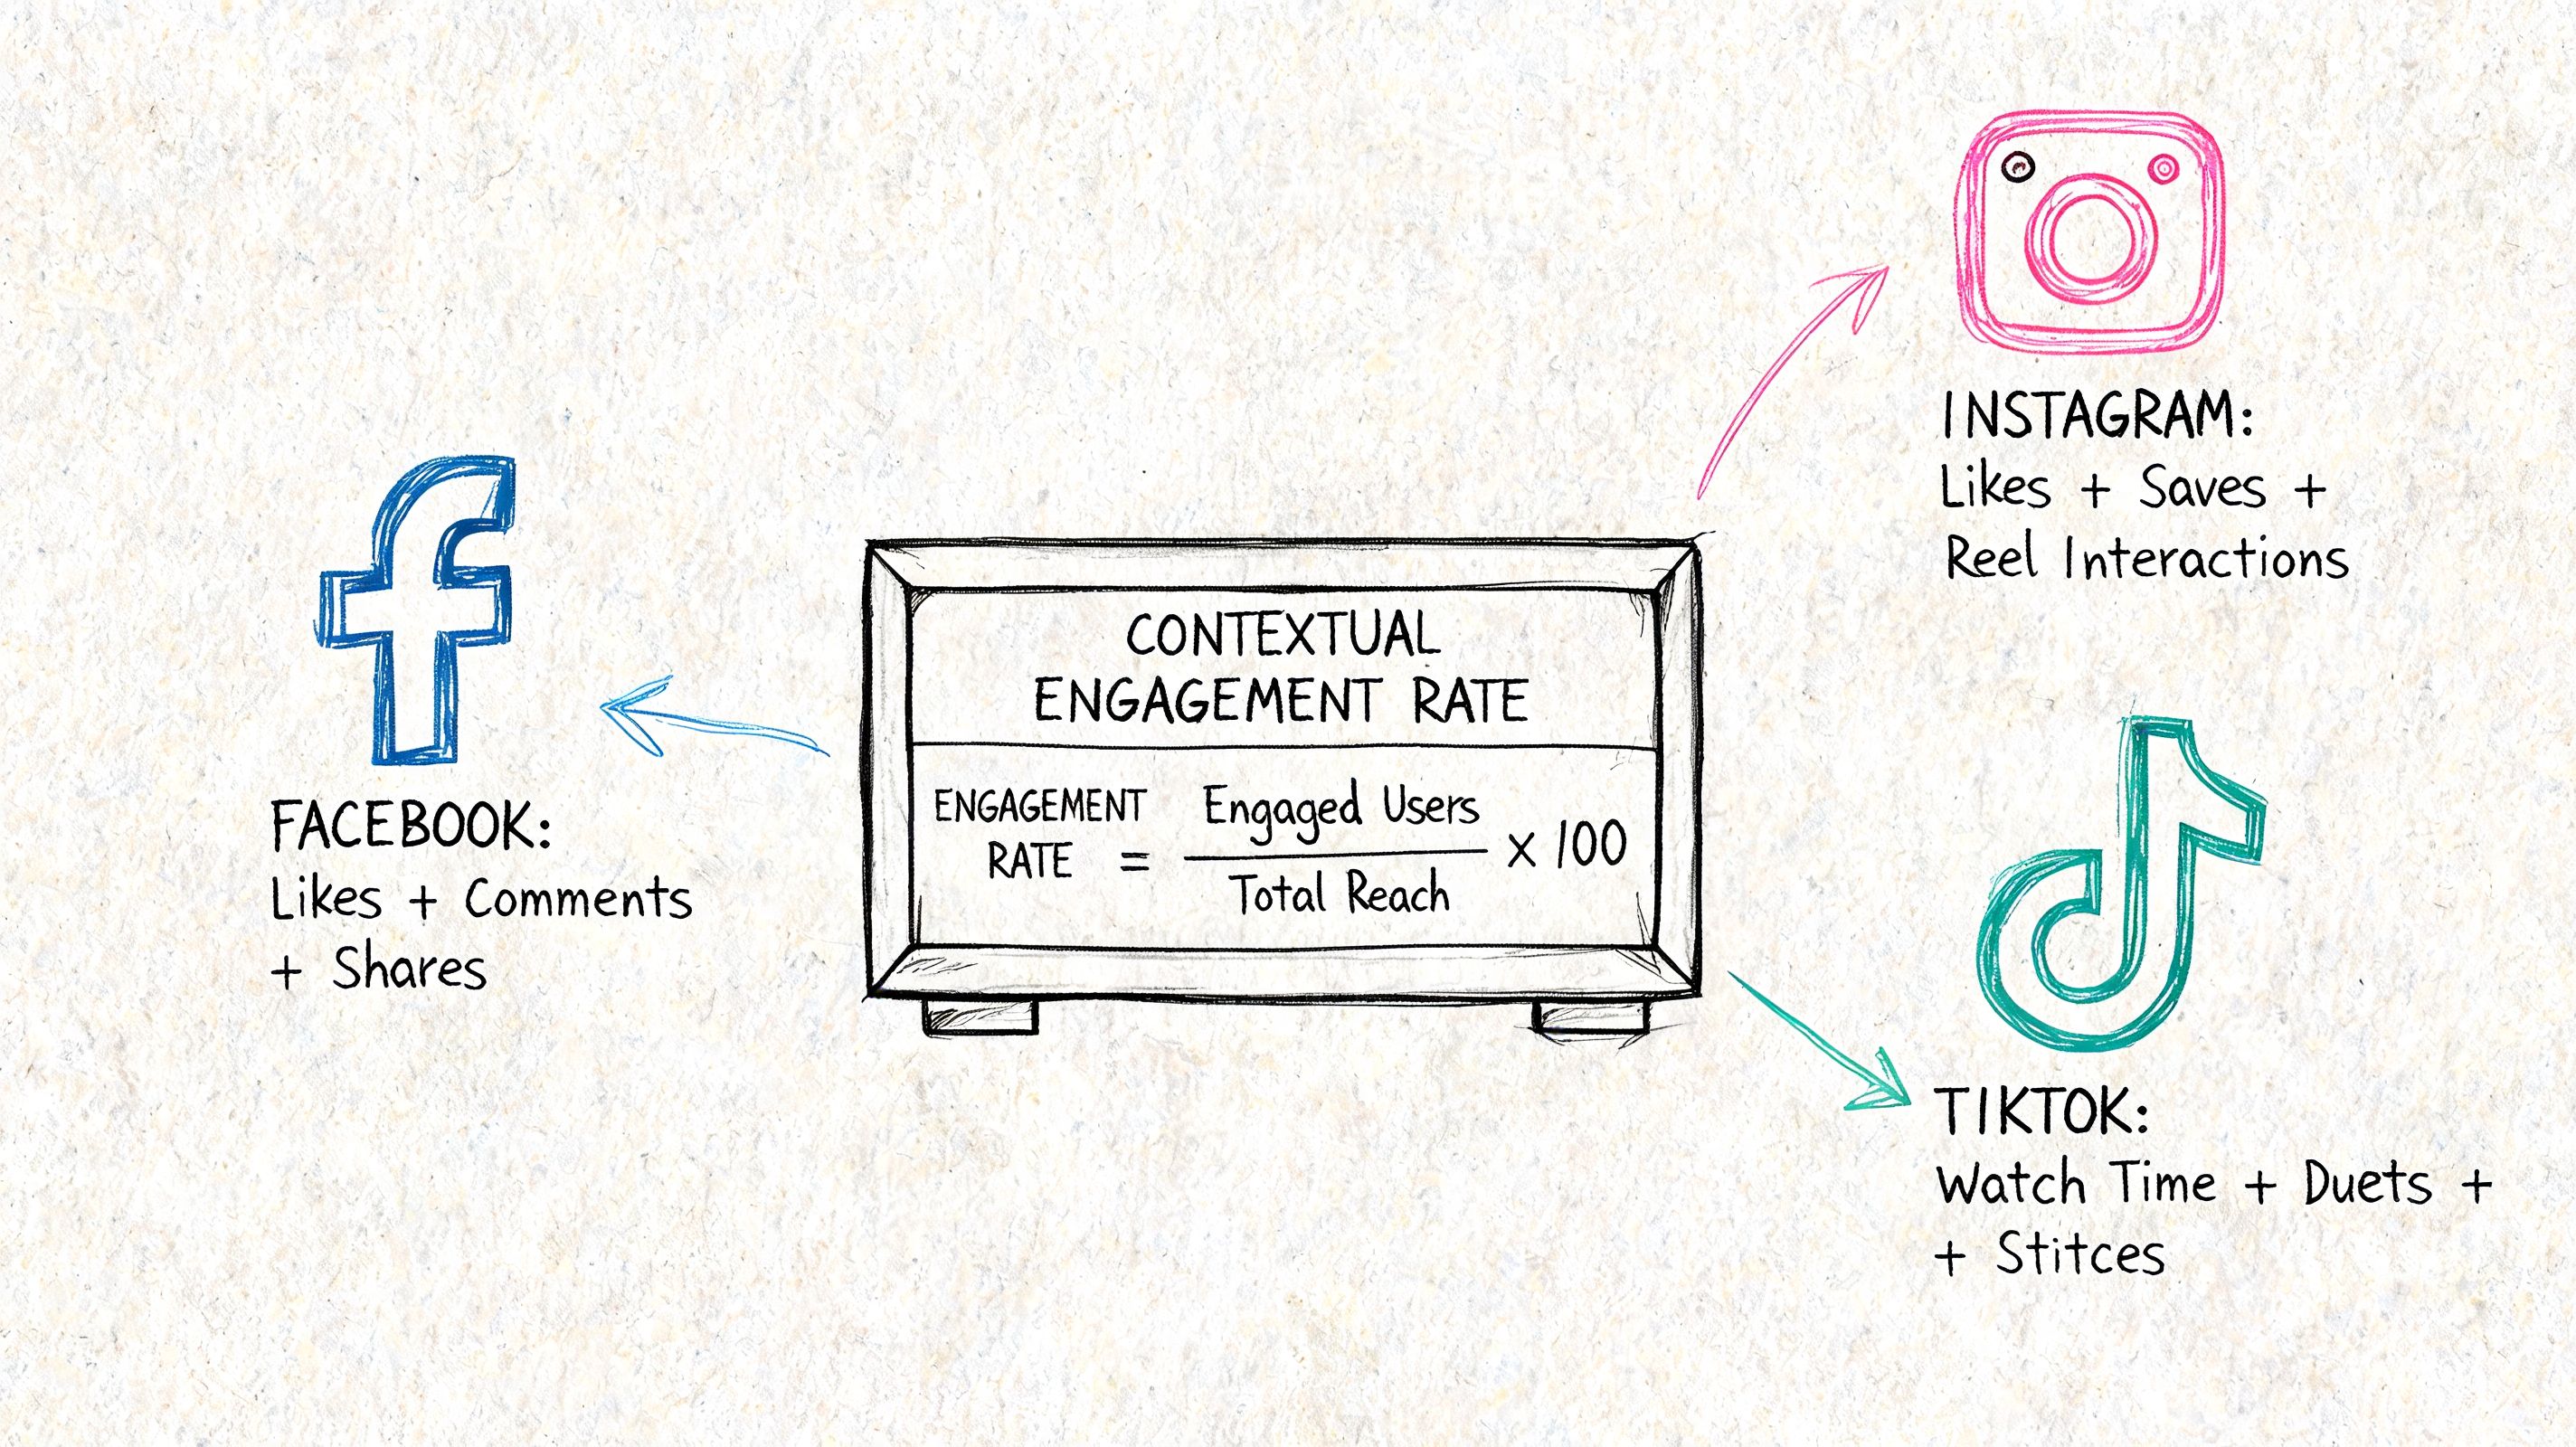
Instagram posts and Reels
Instagram still tempts brands to overweight likes because they are public, fast to collect, and easy to benchmark. They are also one of the weakest signals of buying intent.
For feed posts and Reels, I split interactions into response quality, not just volume:
Likes and comments show immediate reaction
Saves point to utility, consideration, or revisit value
Shares show relevance strong enough to pass to someone else
Profile visits and link clicks matter more when the campaign goal is traffic or sales
That changes how I score performance. A Reel with a modest like count but strong saves, profile visits, and tracked clicks is often more commercially useful than a post that collected cheap engagement and stopped there. If your brief is awareness, broad engagement can be enough. If your brief is commerce, weighted intent signals matter more.
TikTok needs a different reading
TikTok breaks follower-based assumptions because distribution is driven by content response as much as audience size. A creator can post to a relatively small base and still reach a large cold audience.
That makes raw engagement totals easy to overrate. I look harder at the actions that suggest recommendation or purchase intent:
Shares, because they often reflect strong resonance
Comments, because they show conversation, objections, and demand cues
Saves, where available, because they suggest repeat interest
Clicks, if the campaign includes a landing page, product page, or code-led offer
Views, as delivery context rather than engagement itself
TikTok also creates a reporting trap. A video can produce strong in-app signals while driving weak downstream action. For that reason, I do not treat platform engagement as proof of business impact. I treat it as an early indicator, then validate it against UTMs, promo codes, and post-click behaviour. If you need current context on how channel performance and creator formats are shifting, these influencer marketing statistics for 2026 help frame what to watch.
Practical rule: Count the interactions that reflect intent and match the campaign goal. Ignore the ones that only make the screenshot look better.
Stories and short-lived formats
Stories are harder to compare because the valuable actions are often private. Replies, sticker taps, DMs, exits, and link clicks all mean different things, and creators do not always export them the same way.
Set the numerator before launch. If one creator includes replies and sticker taps while another reports reactions only, the comparison is broken before the campaign ends.
Analytics setup matters here. A reporting stack connected to Google analytics mcp helps tie Story traffic to sessions, product views, checkout starts, and revenue, so you can separate social interest from commercial contribution.
A better way to define engagement
The useful question is not “what can this platform count?” It is “which actions are closest to the outcome we need?”
For awareness, broad interaction totals can work. For consideration, saves, shares, and profile visits often tell you more. For sales, I care far more about tracked clicks, code redemptions, assisted conversions, and revenue per creator than a blended engagement rate in isolation.
Use the platform-native signals. Then connect them to attribution. That is how engagement rate stops being a vanity metric and starts becoming part of ROI reporting.
What Is a Good Engagement Rate in 2026
You review two creator campaigns side by side. One delivered a flashy engagement rate and almost no tracked sales. The other looked less impressive in a screenshot but drove code uses, qualified traffic, and repeat orders. That is why “good” needs a business definition before it needs a benchmark.
A useful engagement rate in 2026 is specific to channel, format, audience quality, and campaign objective. It also needs a comparison set that matches the way you calculated it. If one report uses reach-based engagement and another uses follower-based engagement, the ranking is already distorted.
Benchmarks still have value. They just work best as guardrails, not verdicts.
2026 UK average engagement rate benchmarks by reach
Industry / Creator Tier | Average Instagram ER% | Average TikTok ER% |
|---|---|---|
UK ecommerce and DTC brands | Context matters more than a single blended figure | Qualitative only |
UK restaurant brands | Local campaigns often outperform national averages on intent signals | Qualitative only |
I am keeping this table directional on purpose. The fastest way to make a benchmark useless is to force precision where the underlying comparison is mixed across formats, tiers, and reporting methods.
How to judge your result properly
Use four filters before you call a rate good or bad:
Match the formula to the goal. Reach-based engagement is better for content distribution analysis. Follower-based engagement is better for account-level trend tracking.
Compare within the same content type. Reels, Stories, TikToks, carousels, and affiliate posts create different interaction patterns.
Split by creator role. A niche expert, a local food creator, and a broad lifestyle creator can all be successful with very different engagement profiles.
Check whether engagement leads anywhere. Saves, shares, clicks, code redemptions, assisted conversions, and revenue per creator matter more than a blended social score on its own.
Teams often run into trouble by setting one universal target across every creator and every format, then treating any number above it as success. That approach creates bad decisions.
A better standard is to define “good” in layers. First, ask whether the content earned the right kind of response. Then ask whether that response turned into site visits, bookings, leads, purchases, or another trackable action. If the engagement rate is high but nothing downstream moves, the campaign may be creative success and commercial underperformance at the same time.
That is also why strong operators now pair engagement reporting with attribution methods from day one. UTMs, landing pages, promo codes, post-purchase surveys, and platform-side conversion tracking close the gap between social activity and commercial proof. If you need a broader market read before setting targets, this roundup of influencer marketing statistics for 2026 is a solid starting point.
If you are building KPI frameworks beyond engagement, Elyx AI's KPI guide is a useful reference for structuring metrics around business outcomes instead of isolated platform stats.
A good engagement rate is one that helps predict revenue, not just attention.
Measuring Influencer Campaigns for True Business Impact
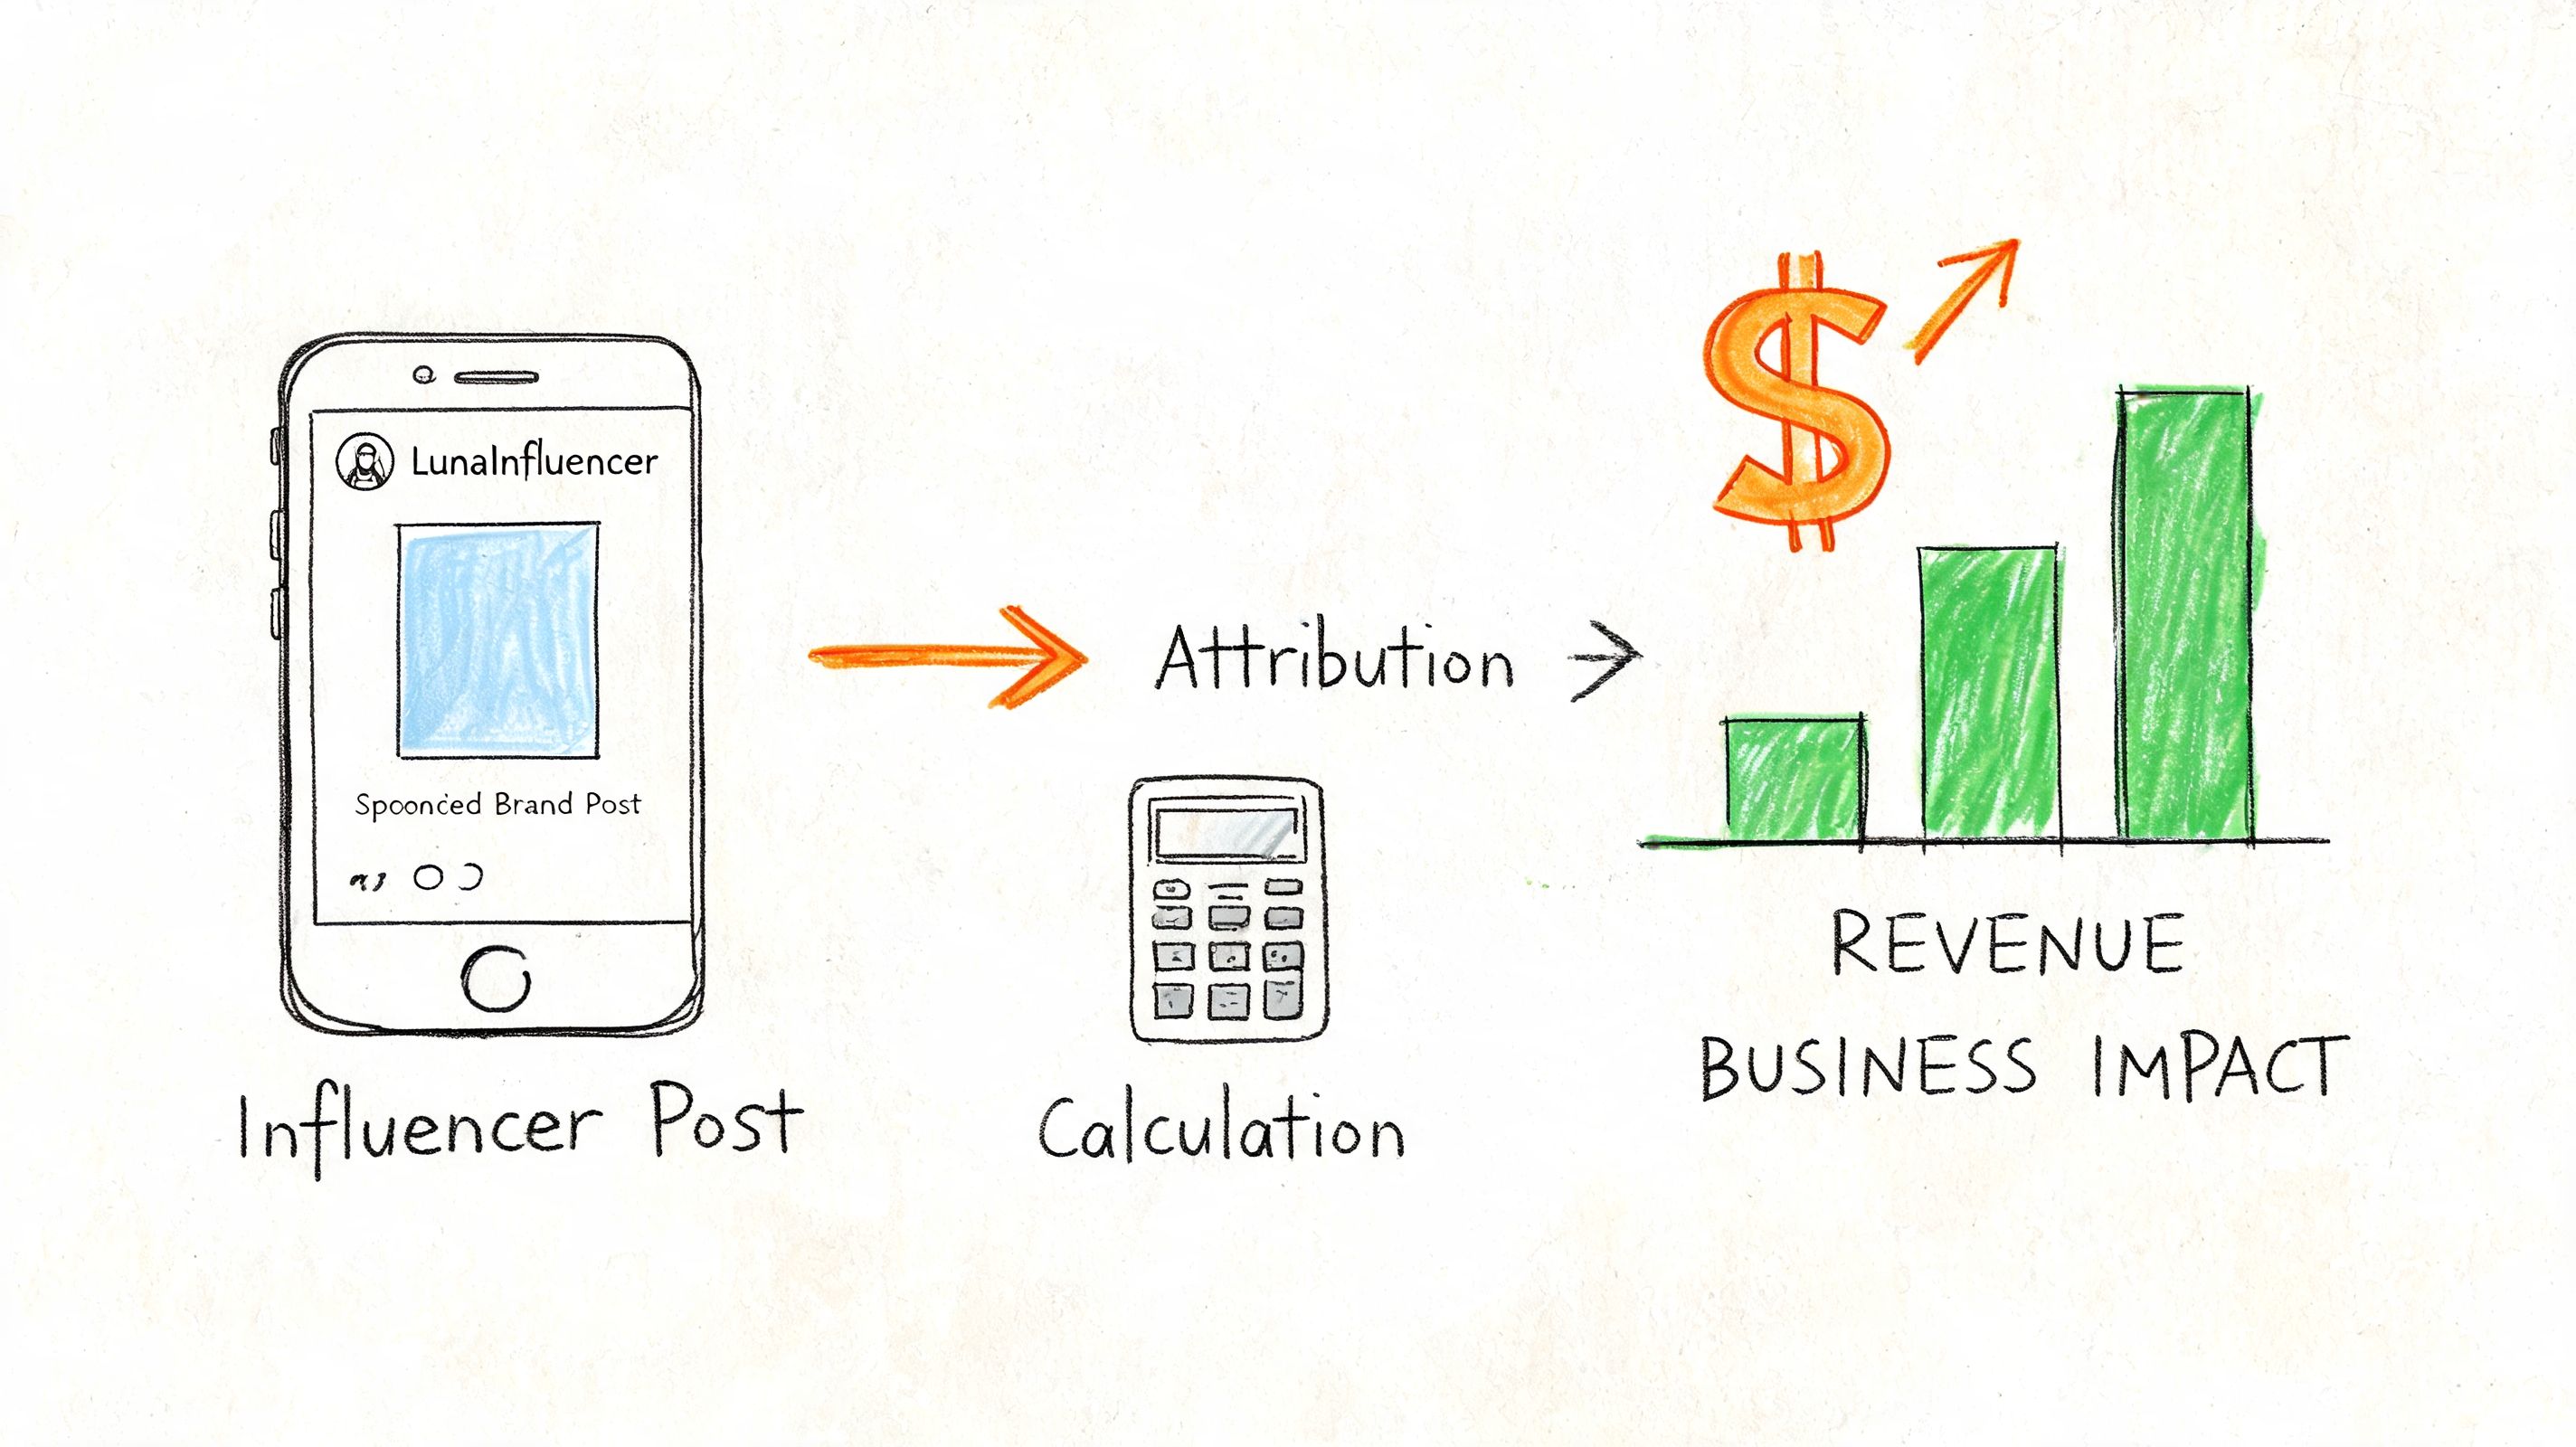
A creator post spikes comments all weekend, the client is pleased, and Monday’s sales report barely moves. That gap is where engagement reporting either earns its keep or turns into decoration.
A campaign can look strong inside the platform and still underperform for the business. The fix is not more engagement reporting. The fix is tying engagement to actions you can attribute, defend, and compare against cost.
Daily engagement rate for ongoing campaigns
Single-post metrics are useful for judging creative performance. They are weaker for managing a live programme across multiple creators, locations, or weeks. Daily Engagement Rate gives you a steadier operating view because it shows whether attention is sustaining, fading, or building over time.
Brandwatch’s social media engagement rate resource presents Daily ER as a practical metric for ongoing performance tracking. That makes it a better fit than one-off post comparisons when your goal is to judge campaign momentum, not just isolate a single content asset.
The formula is straightforward:
Daily ER = (Daily engagements / Followers) × 100
For an average over a period:
Average Daily ER = Total engagements / (Days × Followers) × 100
Use it carefully. Daily ER is good for spotting pattern changes, creator fatigue, or a drop in audience response after the first burst of distribution. It is less useful for proving revenue on its own. A rising Daily ER can mean stronger creative, better posting cadence, or a temporary seasonal lift. It does not tell you which creator drove bookings unless the rest of your tracking is set up properly.
The attribution setup that works
If engagement is going to support an ROI case, tracking needs to be in place before the post goes live. Three parts matter most:
Unique promo codes
Assign each creator a distinct code. Shared codes are easier to manage, but they blur attribution and make it harder to compare creators.Unique UTM links
Give each creator a URL with clear source, campaign, and content parameters. That is what connects engagement to sessions, assisted conversions, and revenue in analytics.A clean event map
Define what counts before launch. Clicks, bookings, purchases, review submissions, code redemptions, and lead form completions all need consistent rules.
This is basic campaign plumbing, but it is where many influencer programmes lose accuracy. Without it, reporting turns into screenshots, creator anecdotes, and last-click guesses. That may be enough for a vanity recap. It is not enough for budget decisions.
What to watch after launch
I track creator performance in layers because each layer answers a different question.
Layer one is social response. Likes, comments, shares, saves.
Layer two is traffic response. Link clicks, landing page sessions, store visits where trackable.
Layer three is business response. Purchases, bookings, review submissions, code redemptions.
That structure helps separate interest from intent. A creator with average social response can still be one of the best commercial performers if their audience clicks, converts, and redeems at a higher rate than a more visible creator. If you want a fuller reporting structure, this guide on how to measure influencer marketing with the metrics that actually matter covers the business side in more detail.
The video below is a useful prompt for thinking about the gap between creator activity and business measurement.
Why teams misread ROI
Bad influencer reporting tends to fail in three places.
First, teams treat all engagement as equal. It is not. A save, a high-intent click, and a code redemption tell you more about purchase consideration than a passive like.
Second, they ignore timing. The same Brandwatch data also shows that engagement can swing with seasonality, which makes clean period-on-period benchmarking important in categories with predictable demand spikes.
Third, they wait too long to intervene. Daily ER can help flag weakening campaigns early, but only if someone uses it as an operating signal instead of a retrospective metric. Creator programmes lose money through drift, not just through obvious failures. Small drops in response, weak clickthrough, broken links, or poor code uptake can sit in a report for weeks if no one is watching the full path from post to purchase.
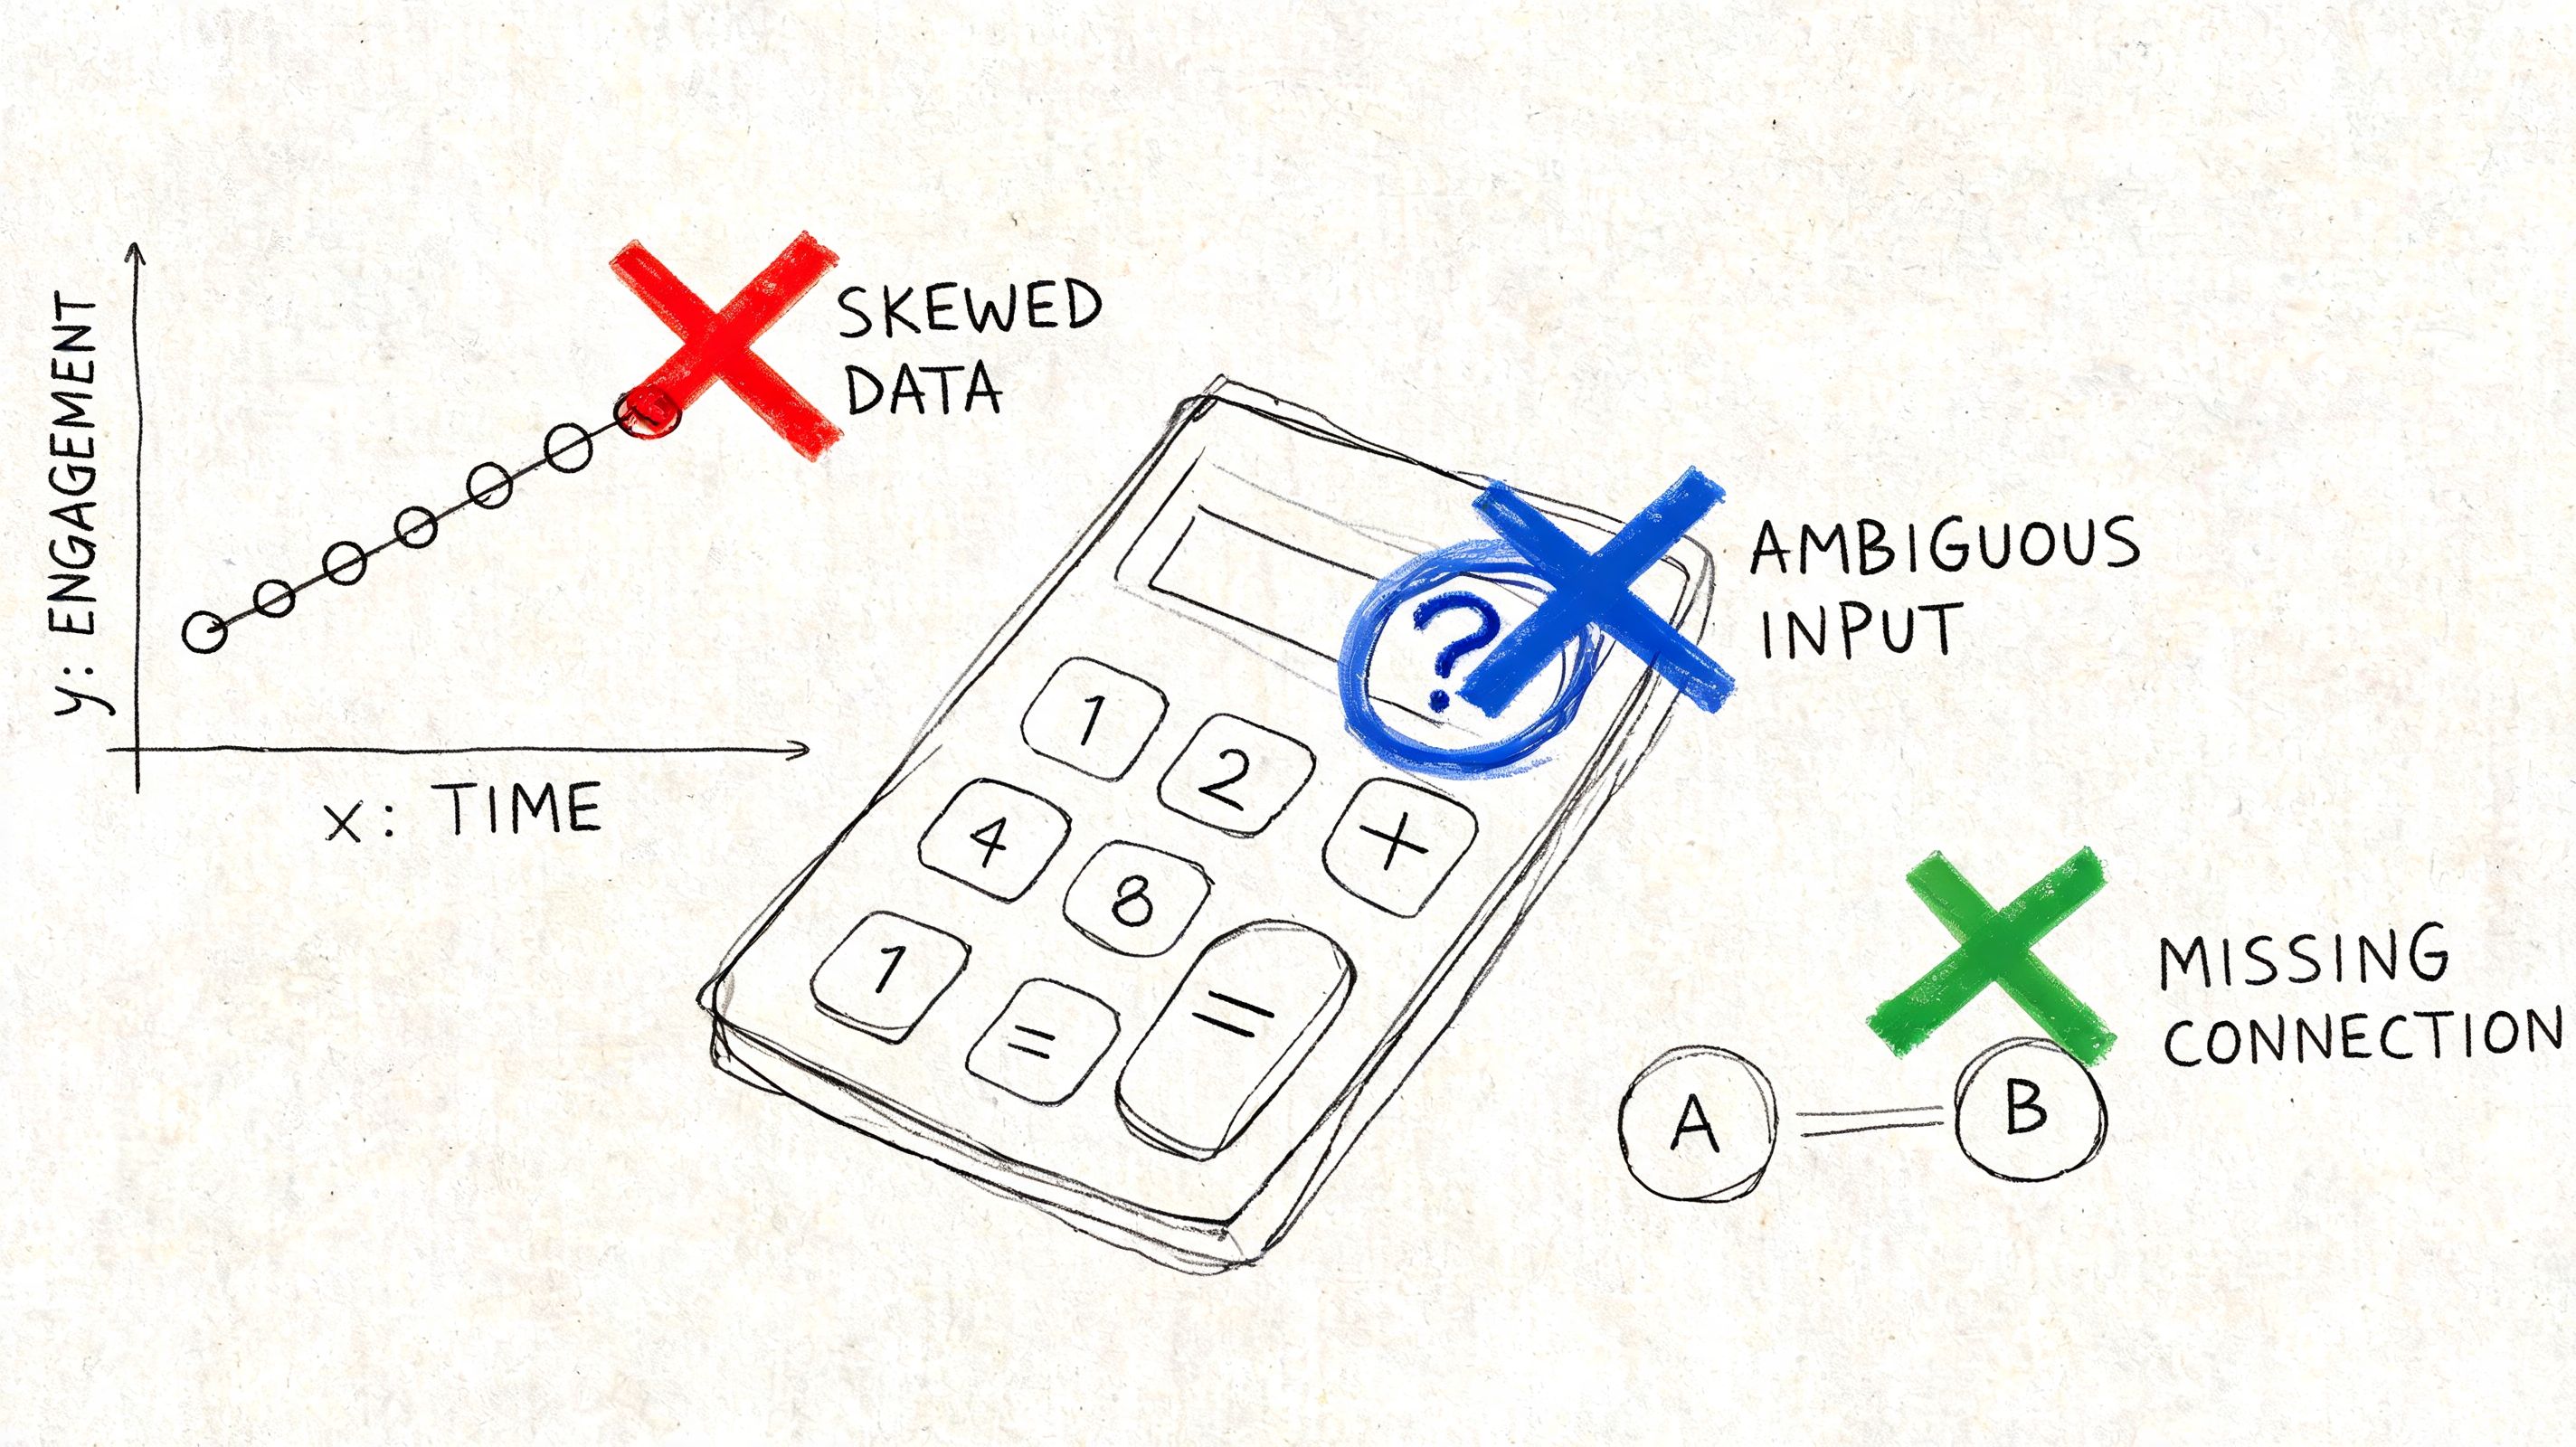
Common Pitfalls When Calculating Engagement
Most engagement mistakes aren’t maths mistakes. They’re judgement mistakes.
Teams often calculate the formula correctly, then make the wrong comparison, include the wrong interactions, or draw a conclusion the metric can’t support. That’s how neat dashboards produce bad marketing decisions.
Mixing formulas in the same report
This is the most common reporting error I see. One row uses ERR, another uses ER post, and someone ranks creators from best to worst.
Don’t do that. A creator can look weaker on a follower-based metric and stronger on a reach-based one if their audience size and distribution pattern differ. Pick one formula per reporting purpose and stick with it.
Overweighting low-intent actions
Likes are visible, fast, and easy to overvalue. They can be useful, but they shouldn’t dominate your interpretation.
A better read gives more attention to actions that imply intent. Shares, saves, replies, clicks, and code redemptions usually tell you more about whether the campaign is moving someone closer to a real outcome.
The easiest interactions to collect are often the least useful for judging commercial impact.
Using inconsistent engagement definitions
If one creator includes link clicks in total engagements and another reports only likes and comments, your comparison is broken before you start.
Create one campaign measurement brief and define the numerator clearly. This matters even more across formats like Stories, Reels, and TikTok, where the platform surfaces different interaction types.
Ignoring seasonality and denominator drift
Audience size and campaign timing both shift the rate.
If follower count changes materially during a campaign, a static denominator can blur the picture. The verified data also warns that seasonality can distort Daily ER, especially in UK summer periods. A rate that looks strong in peak demand may just be riding the calendar.
Treating engagement as the end point
This is the strategic mistake behind most vanity reporting. Engagement is an indicator, not the commercial result.
Use it to decide which creators, formats, messages, and locations deserve more investment. Then connect it to the actions your business cares about. If the chain ends at the social metric, you’re measuring attention, not performance.
If you want to stop piecing together creator screenshots, spreadsheets, promo codes, and UTM reports by hand, Sup gives brands and agencies a done-with-you way to launch, track, and attribute influencer campaigns from first outreach through to clicks, bookings, sales, and reviews.

Matt Greenwell
Share